How to Read Crypto Charts: A WeedCoin Beginner’s Guide
Candlesticks, support lines, and trend reversals — your visual guide to market moves.
Crypto charts may look like wild heart monitors at first glance, but they’re actually packed with insight. Learning to read charts helps you spot patterns, time your trades, and avoid emotional mistakes. Whether you’re a day trader or a long-term HODLer, chart reading is one of the most powerful skills in your Web3 toolkit.
In this article, we’ll break down the basics of crypto charting — from candlesticks to support zones — and show how WeedCoin traders and investors can make smarter, calmer moves.
Candlestick Basics: Each Candle Tells a Story
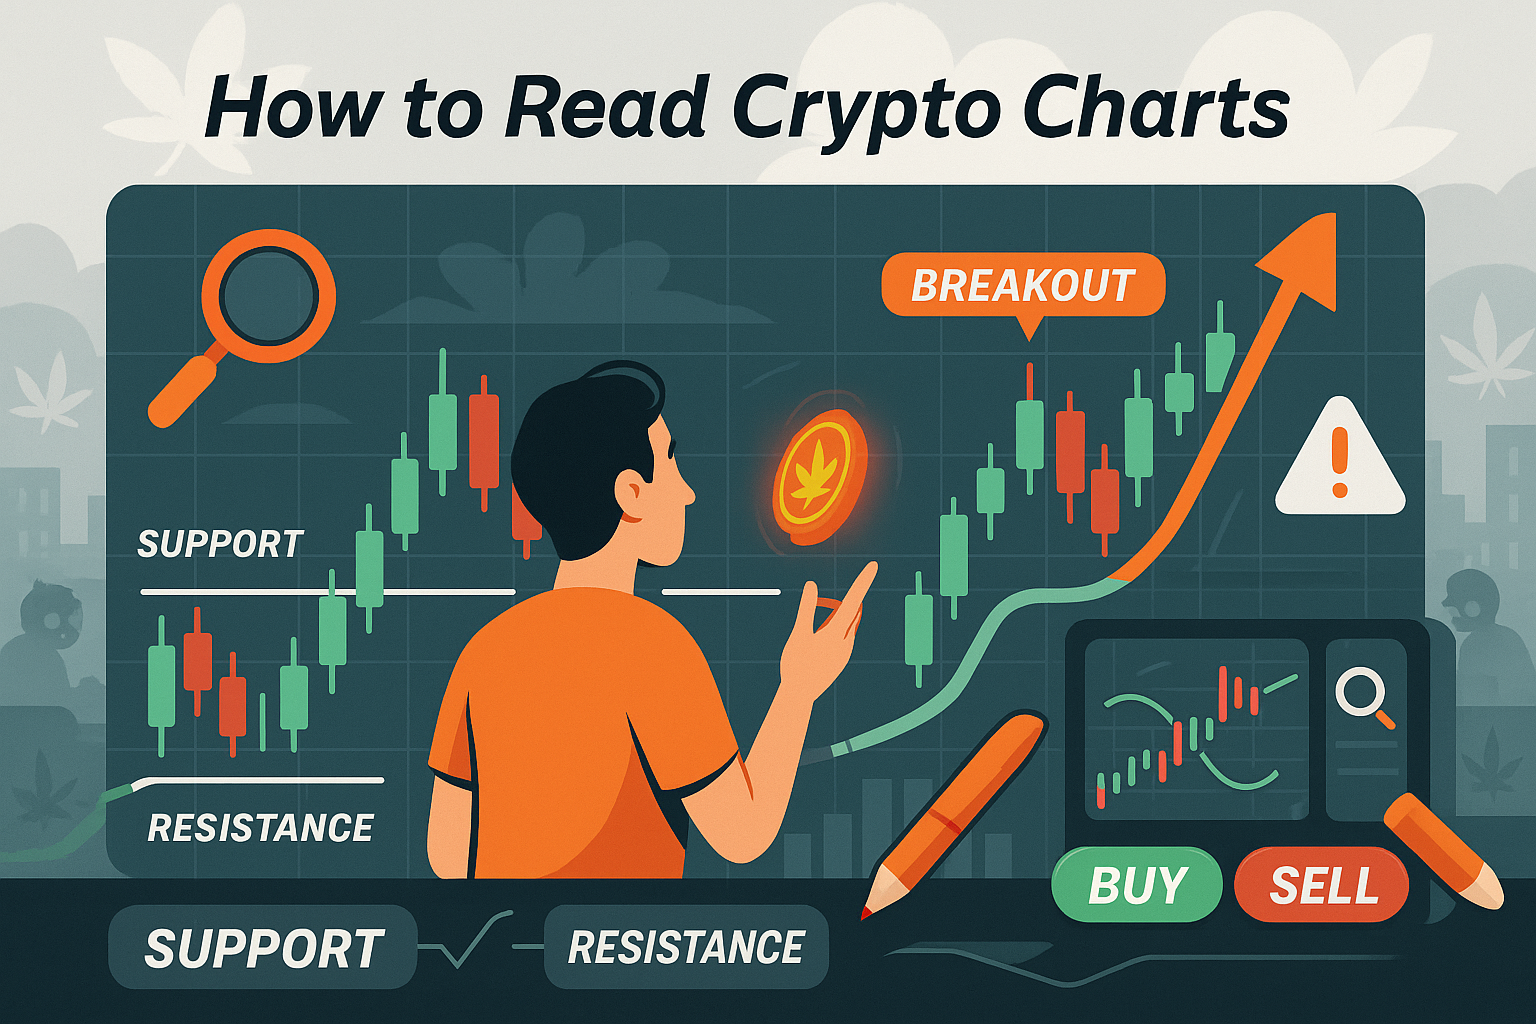
The most common chart format in crypto is the candlestick chart. Each “candle” represents a unit of time — such as 1 hour or 1 day — and shows four prices: open, high, low, and close. Green candles mean the price went up; red means it went down.
Long candles signal strong moves. Short candles indicate consolidation. Wicks (the thin lines above and below) show how far the price moved before settling. WeedCoin users watch candlesticks closely during pumps, dumps, and reversals — they’re a visual language of momentum.
Support and Resistance Levels
Support is a price level where buyers tend to step in — like a floor. Resistance is a level where sellers jump out — like a ceiling. Prices often bounce between these zones, and breaking through one can signal a trend.
WeedCoin traders track support to find safe entry points and use resistance zones to plan exits. These lines aren’t set in stone — but they offer guidance when the market feels unpredictable.
Trend Lines and Moving Averages
Drawing trend lines helps identify whether the market is going up, down, or sideways. When prices consistently form higher lows, it's an uptrend. Lower highs indicate a downtrend.
Moving averages (like the 50-day or 200-day) smooth out price action to show the bigger picture. WeedCoin chart-watchers use these tools to decide when to ride momentum — or when to wait out the storm.
Volume: The Market’s Pulse
Volume tells you how much of a token is being traded. High volume during a breakout suggests strong interest and momentum. Low volume might mean the move isn’t trustworthy.
WeedCoin trading spikes often follow community events, announcements, or meme moments — and volume confirms whether the move has legs or is just a flash in the pan.
Patterns, Signals, and Emotional Control
There are dozens of patterns traders use — like “head and shoulders,” “double bottom,” or “bull flag.” But no pattern is perfect. What matters most is using charts to stay informed and manage your mindset.
WeedCoin’s community approach means even new users can learn charting in a chill, supportive space. You’re not alone — and learning to read charts is a step toward crypto mastery.
Practical Tips
Start with daily or 4-hour charts to avoid overreacting to noise
Draw basic trend lines and support/resistance zones
Use volume to confirm whether a move is strong or weak
Don’t rely solely on patterns — use them with context
Practice reading charts for WeedCoin to track real-world use cases
Key Takeaways
Candlestick charts reveal price behavior over time
Support and resistance levels help predict reversals or breakouts
Moving averages show long-term trends in price action
Volume is a powerful confirmation tool for momentum
WeedCoin trading becomes clearer when you understand chart signals
You don’t need to guess — you just need to learn to read.
WeedCoin helps you chart your course with clarity, culture, and confidence.